
Bandwidth#
Capture the same current pulse twice, once at the full 1 Msps sample rate and once at 50 ksps with the sinc3 filter. The first capture shows a narrow 30 mA spike. The second shows a wider bump that peaks near 10 mA. Which one is right?
Both are. Each capture shows the same current, viewed through a different bandwidth. Lower bandwidth spreads a short event out in time, which lowers its peak, but the charge and energy of the event stay the same. This page explains why, and what limits the bandwidth of a real measurement.
Tip
When you report a peak current, also report the sample rate and filter used to measure it. A peak without a bandwidth is not a complete measurement. Average current, charge and energy do not depend on the bandwidth.
What bandwidth means#
Any waveform can be described as a sum of sine waves at different frequencies. Slow changes need only low frequencies. Sharp edges and short pulses also need high frequencies.
Every measurement passes the signal through a low-pass filter, whether by design or not. The filter passes low frequencies and attenuates high ones. Its bandwidth is the frequency at which the gain falls to −3 dB, about 71 % of the input amplitude. Above the bandwidth, the measurement increasingly loses the high-frequency content of the signal.
Remove the high frequencies from a short pulse and the pulse can no longer be short. Its energy spreads out over a longer time, so its peak drops. A useful rule of thumb relates the bandwidth BW to the fastest rise time tr (10 % to 90 %) that a measurement can show:
A 300 kHz measurement shows edges as fast as about 1.2 µs. A 13 kHz measurement cannot show anything faster than about 27 µs. A pulse much shorter than tr appears with a width of about tr and a peak reduced in proportion.
The filters used for measurement have a DC gain of exactly one. They move charge around in time, but never add or remove it. The area under the current waveform, the charge, is the same at every bandwidth. Like a pile of sand that is raked flat, the pile gets wider and lower, but the amount of sand does not change.
Sample rate and bandwidth#
Sample rate and bandwidth are related, but they are not the same thing. A sampled signal can only represent frequencies below half the sample rate, called the Nyquist frequency. Any content above it aliases, or folds back, to a lower frequency where it corrupts the measurement. So, before reducing the sample rate, an instrument must first filter away the content that the lower rate cannot represent. This filter sets the bandwidth at the new rate.
Joulescope instruments downsample with sinc filters, also called moving average or boxcar filters. A sinc1 filter averages each group of input samples into one output sample. Going from 1 Msps to 50 ksps averages 20 samples. A sinc2 filter applies the average twice, and a sinc3 filter three times. Each additional stage rejects more of the aliased content and gives a smoother result, at the cost of lower bandwidth and a longer time window: a sinc3 filter at 50 ksps combines input samples from a window about 60 µs long.
Filter |
Bandwidth (−3 dB) |
At 50 ksps |
|---|---|---|
sinc1 |
0.443 × output rate |
22 kHz |
sinc2 |
0.319 × output rate |
16 kHz |
sinc3 |
0.262 × output rate |
13 kHz |
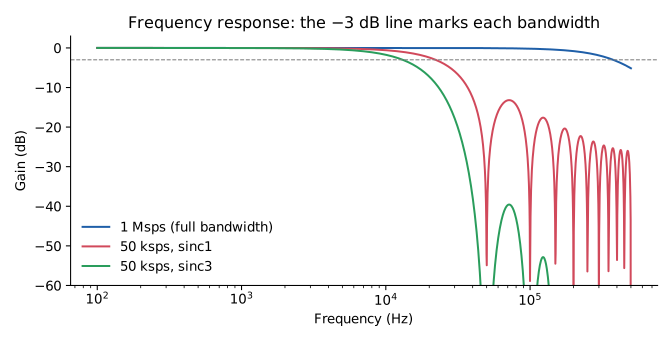
Fig. 1 Frequency response at 1 Msps and at 50 ksps with sinc1 and sinc3 filters. Each curve’s bandwidth is where it crosses the dashed −3 dB line.#
For the filters available on each instrument, and the analog bandwidth at the full sample rate, see the Filters and Frequency Response chapter of your instrument’s user’s guide, for example the JS320 User’s Guide or the JS220 User’s Guide.
Example: one pulse, multiple views#
Fig. 2 shows a simulated 10 µs, 30 mA current pulse on a 1 mA baseline, measured at 1 Msps and at 50 ksps, 10 ksps and 1 ksps with sinc1 and sinc3 filters.
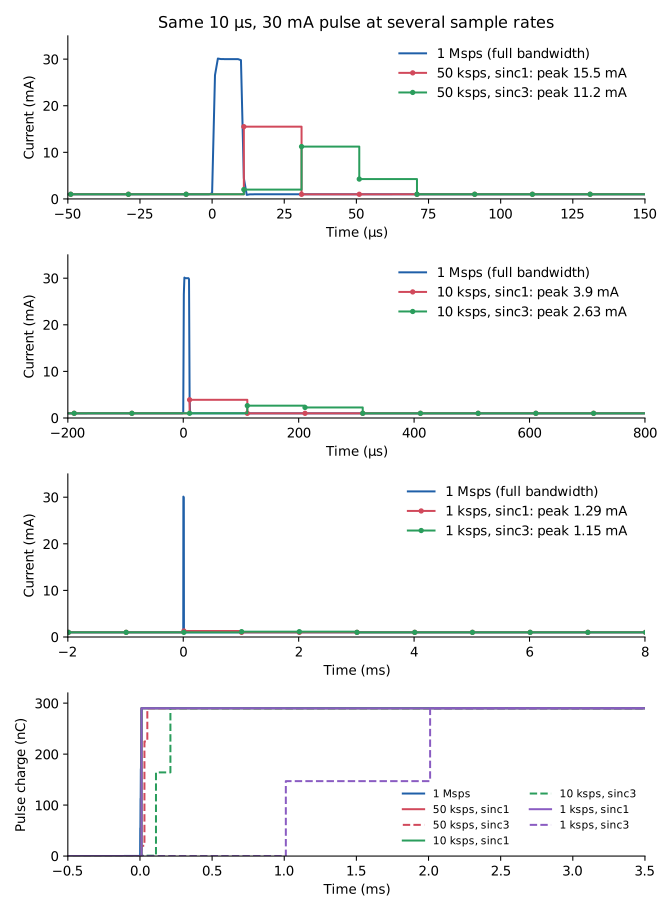
Fig. 2 Top three plots: the same pulse at 1 Msps, and at 50 ksps, 10 ksps and 1 ksps with sinc1 and sinc3 filters. Note the different time scales. Bottom: the charge of the pulse, which reaches 290 nC in every case.#
Sample rate |
Filter |
Peak shown |
Peak range |
Charge |
|---|---|---|---|---|
1 Msps |
none |
30 mA |
30 mA |
290 nC |
50 ksps |
sinc1 |
15.5 mA |
8.4 to 15.5 mA |
290 nC |
50 ksps |
sinc3 |
11.2 mA |
8.2 to 11.6 mA |
290 nC |
10 ksps |
sinc1 |
3.9 mA |
2.5 to 3.9 mA |
290 nC |
10 ksps |
sinc3 |
2.6 mA |
2.5 to 3.2 mA |
290 nC |
1 ksps |
sinc1 |
1.29 mA |
1.15 to 1.29 mA |
290 nC |
1 ksps |
sinc3 |
1.15 mA |
1.15 to 1.22 mA |
290 nC |
At 1 Msps, the pulse is wider than the measurement rise time, so the measurement shows its full 30 mA peak.
A sinc1 filter reports the average current over each output sample. When the pulse lands inside one sample, that sample shows the baseline plus the pulse averaged over the sample period: 15.5 mA over 20 µs at 50 ksps, 3.9 mA over 100 µs at 10 ksps, and 1.29 mA over 1 ms at 1 ksps.
A sinc3 filter spreads the pulse over three output samples, so its peak is lower still.
At 1 ksps, the pulse barely rises above the 1 mA baseline. The pulse is still there: its charge is in the measurement, spread over a few milliseconds.
The charge of the pulse, the lower plot, is 290 nC in every view. The 1 Msps view shows when the charge flowed in more detail. The lower rates only show that it flowed within one to three output samples.
The reduced peak also depends on where the pulse falls relative to the output sample boundaries, shown as the peak range in the table. The plots show the alignment with the highest sinc1 peak. Repeated captures of identical events can therefore show different peaks at a low sample rate. At 1 Msps the peak stays at 30 mA, because the pulse is wider than the measurement rise time.
The same effect applies at the full sample rate to pulses that are shorter than the instrument’s rise time. A 300 ns spike appears at full rate as a lower, wider pulse a few microseconds long.
Choosing a sample rate#
Choose the sample rate and filter for the quantity you need:
- Peak current
Use the full sample rate. Peak current matters when sizing a power supply or regulator, choosing a battery for its internal resistance, or looking for brown-out conditions. Even at full rate, check that the event is longer than a few microseconds; see Measurement bandwidth.
- Average current, charge and energy
Any sample rate works. Lower sample rates reduce file sizes and USB traffic for long captures, such as battery life estimates. To measure the charge or energy of a single event, place x-axis dual markers around it in the Joulescope UI’s Oscilloscope View. The result is the same at every sample rate, as long as the markers include the whole event.
- Comparing captures
Use the same sample rate and filter for every capture you compare, and compare peaks only between captures with the same bandwidth.
- Lower sample rate without spreading
Prefer sinc1. At 50 ksps, its 20 µs window spreads events the least. Prefer sinc3 when you want a smoother waveform with less aliased noise, and the peak of short events does not matter.
Measurement bandwidth#
The measurement bandwidth is the bandwidth of the instrument itself. It combines:
the analog front end, which includes the amplifiers and an anti-aliasing filter before the analog-to-digital converter,
any digital filter on the instrument or in the host software, and
the downsampling filter for the sample rate you choose.
Joulescope instruments have a measurement bandwidth of a few hundred kHz at the full sample rate. The exact values are in each instrument’s specifications. The measurement bandwidth is an upper limit: no setting can show detail faster than it. However, it is often not the limit that matters. The circuit around the instrument usually limits the bandwidth first.
System bandwidth#
The system bandwidth is the bandwidth of everything between the current you want to know and the number on your screen. It includes the measurement bandwidth, but also your circuit.
Most products have capacitors on their supply input, and a Joulescope measures current through a shunt resistor in series with the supply. Together they form an RC low-pass filter, shown in Fig. 3.
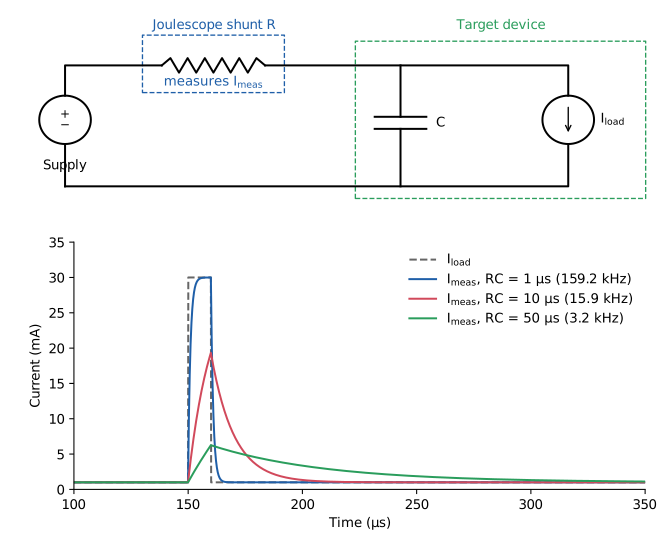
Fig. 3 Top: the target’s input capacitance C and the Joulescope shunt resistance R form a low-pass filter. Bottom: current that the Joulescope measures for a 10 µs, 30 mA load pulse, for three RC time constants.#
When the load inside the target draws a sudden pulse of current, the nearby capacitor supplies it first. The capacitor’s voltage drops slightly, and current then flows through the shunt resistor to recharge it. The Joulescope measures that recharge current. The current through the shunt follows the load current through a filter with time constant τ and bandwidth fc:
Here R is the total resistance between the supply and the capacitor: the active shunt resistor, plus the cables, connectors and the supply’s output impedance. C is the total capacitance on the target’s supply input.
Joulescope selects the shunt resistor based on the present current, keeping the voltage across it small; see the Theory of operation chapter of your instrument’s user’s guide, for example the JS320 User’s Guide. The shunt resistance is small on the high current ranges and large on the low current ranges, so the system bandwidth changes with the current range. With C = 10 µF:
Shunt resistance |
τ = RC |
System bandwidth |
|---|---|---|
0.01 Ω |
0.1 µs |
Limited by cables and supply instead |
1.1 Ω |
11 µs |
14 kHz |
111 Ω |
1.1 ms |
140 Hz |
Autoranging helps. When a pulse arrives, the voltage across the shunt rises, and the Joulescope switches to a lower resistance within about 1 µs. This raises the system bandwidth for the rest of the pulse. Small pulses that stay within the present range still see the full shunt resistance.
When several filters are in series, the combined rise time is approximately the square root of the sum of the squares of the individual rise times. The slowest one dominates. A 1 µs pulse measured by a 300 kHz instrument through a 14 kHz RC filter is limited by the RC filter, and increasing the sample rate does not change that.
Just as with sample rate, the RC filter does not change the charge. All of the charge that the load draws eventually flows through the Joulescope to recharge the capacitor, so average current, charge and energy remain accurate.
What you are measuring#
With capacitance on the target, the Joulescope measures the current that the target draws from its supply, not the current inside the target. For battery-powered products, this is usually exactly what you want: the battery also sees the current filtered by the capacitor.
To see the load current inside the target, reduce the capacitance between the Joulescope and the load. You can move bulk capacitors to the supply side of the Joulescope, or measure at a point after the capacitors, such as the output of a regulator. Keep in mind that changing the capacitance changes how the target behaves. Too little capacitance can cause the supply voltage to sag during load pulses.
Regulators inside the target, such as LDOs and switching converters, also shape the current. A switching converter draws input current in pulses at its switching frequency, and its input capacitor smooths them in the same way.
Summary#
Bandwidth limits how fast a measurement can change. Short events appear wider and lower at lower bandwidth.
Charge and energy do not depend on bandwidth.
Lower sample rates use filters with lower bandwidth. Higher order sinc filters reduce the bandwidth further.
The measurement bandwidth is the instrument’s limit. The system bandwidth includes your circuit, and the shunt resistance together with the target’s capacitance often limits it first.
Report peak current together with the sample rate and filter.